If your ProcessOn diagram feels cluttered or “off,” you’re not alone. In 15–30 minutes, you can transform most messy canvases into clean, readable flows. This guide shows you exactly how—using ProcessOn’s alignment, distribution, connector, and styling tools—plus quick verification and troubleshooting steps.
Why this works: Clear alignment, consistent spacing, and limited color greatly improve scan-ability and comprehension, principles echoed in the Interaction Design Foundation’s overview of visual hierarchy (2025). See the explanation in Interaction Design Foundation — Visual hierarchy.
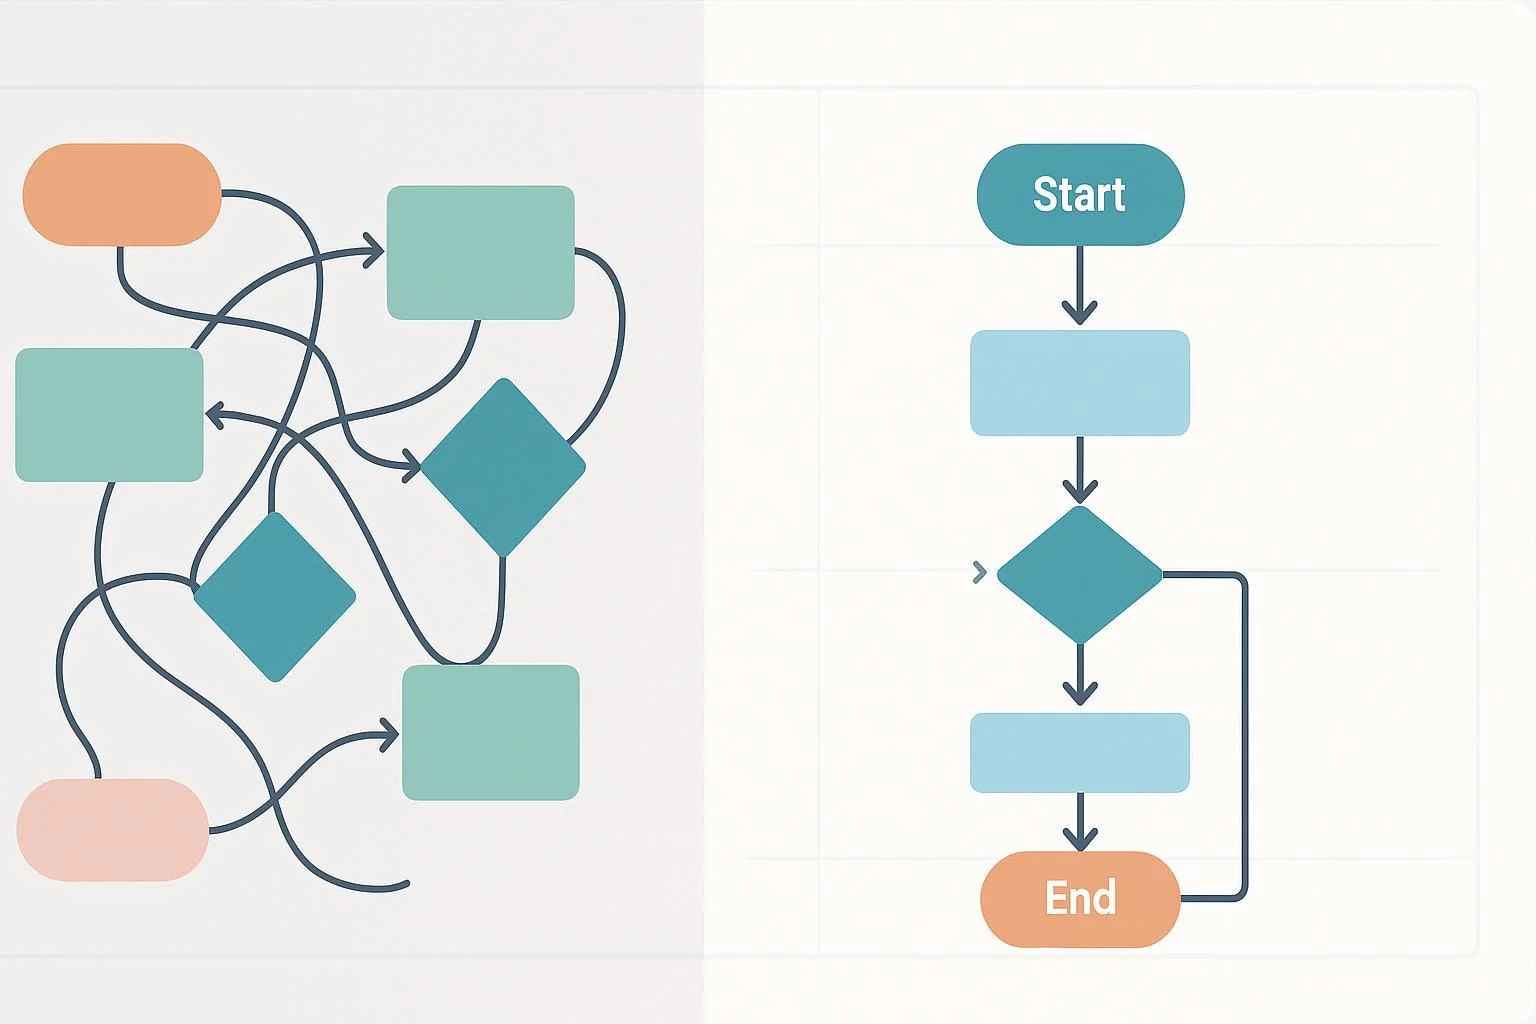
Step 0: Quick Diagnosis (60–90 seconds)
Before fixing, scan your diagram for these symptoms:
- Layout
- Rows/columns look crooked or gaps feel uneven
- Flow direction flips partway (e.g., starts top-to-bottom, then turns left-to-right)
- Connectors
- Lines crisscross or overlap shapes
- Mixed arrowhead styles or directions
- Text
- Labels overflow shapes or wrap awkwardly
- Inconsistent case (Title Case vs. sentence case) and verb tense
- Visual style
- Too many colors, inconsistent fills, mixed fonts/line weights
- Low contrast makes text hard to read
- Scope
- One canvas trying to show everything; no clear Start/End; subflows missing
Circle the top 2–3 issues—you’ll fix those first.
Step 1: Straighten Layout with Align and Distribute
Goal: Make rows/columns crisply aligned and evenly spaced.
- Select two or more shapes in a row or column (Shift+click or drag-select).
- Use the top toolbar or right-click context menu to apply Align:
- Align Left/Center/Right for vertical stacks
- Align Top/Middle/Bottom for horizontal rows
- With the same selection, apply Distribute Horizontally or Distribute Vertically to equalize gaps.
- Drag to reposition; ProcessOn may show smart alignment aids while you move shapes to snap into line (not a toggle, but visual guides you’ll see as you drag).
Tips and pitfalls
- Align first, then Distribute; reversing the order can “average” a crooked baseline.
- If a shape must stay offset (e.g., annotation), exclude it from the selection before distributing.
- Use tiny nudges for fine-tuning; check at 50% zoom to ensure gaps look even.
Evidence and where to find the tools
- ProcessOn’s product and tutorial pages show Align and even distribution controls available when multiple elements are selected; see the ProcessOn Flowcharts product page (feature overview, 2025) and the step-by-step guidance in ProcessOn — How to make a flow chart? (2025).
Verification
- Zoom out to 25–50%. Rows and columns should read as straight lines with consistent spacing.
Step 2: Clean Up Connectors (Reduce Crossings to Near-Zero)
Goal: Make paths readable and unambiguous.
- Prefer straight or orthogonal (right-angle) connectors in dense areas.
- To switch types, select a connector and change its style in the right sidebar (Line/Graphic Style). Choose consistent arrowheads.
- Reroute around shapes: Drag a segment to add a waypoint and create a clear detour.
- If two or more crossings remain in any region, move nodes to create straighter paths or extract a subflow (see Step 5).
Why this matters
- Reducing crossing lines lowers visual clutter and improves comprehension. This aligns with guidance on common diagram mistakes; see Miro — Avoid mistakes, make diagrams clearer (2024).
ProcessOn-specific notes
- Connector type and arrowhead settings live in the right toolbar; tutorials walk through these options in context. See ProcessOn — Process flow diagram tutorial (updated 2025).
Verification
- Do a “path trace” from Start to End. If you hesitate at a junction, simplify routing or spacing.
Step 3: Fix Labels and Text Readability
Goal: Keep labels concise, consistent, and legible.
- Shorten long labels; split a compound idea into two steps if needed.
- Standardize casing: pick sentence case or Title Case and apply it everywhere.
- Adjust font size and shape width in the top toolbar so text doesn’t overflow.
- Reserve bold or color for emphasis only; avoid rainbow text.
Why this matters
- Size, spacing, and consistent typography create hierarchy and reduce cognitive load; see the 2025 overview from Interaction Design Foundation — Visual hierarchy and whitespace fundamentals from Venngage — Using white space in design (2025).
Verification
- Print-preview or export as PNG/PDF and check at 100% zoom. If small text looks fuzzy or cramped, bump the size one step.
Step 4: Apply Consistent Styles (Colors, Lines, Fonts)
Goal: Make the diagram feel cohesive and purposeful.
- Multi-select similar shapes (e.g., all processes) and set the same fill, stroke, and font in the top toolbar.
- Use the right sidebar’s Style controls for detailed line weight and arrowhead consistency.
- Limit palette to 3–5 colors: one neutral base, one accent for highlights, plus a warning color if needed.
- Consider starting from a coherent template so styles are pre-set.
ProcessOn references
- Tutorials demonstrate using the top toolbar and right panel for style consistency and template use; see ProcessOn — How to make a flow chart? (2025).
Verification
- At 50% zoom, colors and weights should look balanced. No single color should dominate unless it signals a specific meaning.
Step 5: Group, Segment, and Right-Size the Scope
Goal: Reduce crowding and make structure obvious.
- Group related nodes (right-click selection → look for Group). This keeps clusters together while you align/distribute.
- Lock stable elements (e.g., headers, legends) so they don’t shift accidentally.
- Use swimlanes/containers to segment responsibilities or phases; drag lane/pool shapes from the left panel in relevant templates.
- If the canvas still feels dense, split complex branches into separate diagrams. In the main flow, replace the branch with a subprocess step that references the detailed diagram. (Hyperlinking labels varies by editor version; if available, access via right-click or the right sidebar. If not, add a short note and place the link in your documentation.)
ProcessOn references
- Swimlane support and related templates are documented on product/tutorial pages; see ProcessOn — Swimlane diagrams (2025) and the walkthrough in ProcessOn — How to draw a swimlane (2025).
Verification
- Zoom out: each lane/section should read as a clean block. If you can’t explain a lane’s purpose in one sentence, rethink the segmentation.
Step 6: Enforce a Single Reading Direction
Goal: Make flow predictable.
- Choose top-to-bottom or left-to-right; don’t mix directions within a single canvas.
- Align columns/rows accordingly and normalize gaps using Align + Distribute.
- Use arrowheads consistently to reinforce direction.
Reasoning
- Predictable structure plus whitespace improves scan time and comprehension; see Venngage — Using white space in design (2025).
Verification
- Ask a peer to start at “Start” and narrate the path in 60 seconds. If they turn back or get lost, you likely have mixed directions or confusing branches.
Step 7: Verify Before You Share
Run this fast loop to catch issues early:
- Zoom-out test (25–50%): Check alignment lines and spacing rhythm.
- Export test: PDF or PNG, then view at 100% to confirm text size and line weights.
- Peer skim: 2-minute read from Start to End. Note any hesitation points and fix crossings, labels, or spacing.
ProcessOn export reference
- ProcessOn’s tutorials note exporting to PNG and PDF from File → Export (or top-right export controls depending on diagram type); see ProcessOn — Software architecture diagrams guide (2025).
Troubleshooting Mini-Playbooks
Use these quick recipes for the most common messes.
- Lines crossing everywhere
- Switch dense areas to orthogonal connectors.
- Move nodes to establish straighter main paths; then Align + Distribute.
- If 2+ crossings remain in a region, extract that branch into a sub-diagram and reference it.
- Refer to ProcessOn connector guidance in ProcessOn — Process flow diagram tutorial (updated 2025) and clarity tips in Miro — Avoid mistakes, make diagrams clearer (2024).
- Crowded canvas
- Increase spacing via Distribute; limit colors to a compact palette.
- Group related steps and use containers/swimlanes.
- Offload a branch to another diagram; leave a subprocess step as a pointer.
- Labels that overflow
- Shorten text or break into two steps; slightly widen the shape.
- Standardize casing (Title Case or sentence case) and keep tense consistent.
- Increase font size if the export preview looks cramped.
- Mixed directions and inconsistent arrowheads
- Pick a single direction and realign columns/rows.
- Standardize arrowheads via the right sidebar; keep directionality consistent.
- Inconsistent colors/line weights
- Multi-select similar elements and apply uniform fills, strokes, and fonts.
- Use a template or set of presets to keep styles consistent across pages; see styling walk-throughs in ProcessOn — How to make a flow chart? (2025).
Pro Tips from Practice
- Start with structure, then decorate: Align/distribute first, then color and typography.
- Keep a legend simple: If colors encode meaning, place a small legend in a corner and lock it.
- Reuse patterns: Copy tidy clusters (with spacing) instead of redrawing from scratch.
- Avoid tiny differences: Two nearly identical fonts or line weights create visual noise; pick one and apply it consistently.
Quick Final Checklist
Run this before you export or share.
- Alignment and spacing
- Rows/columns are straight; gaps feel even at 50% zoom.
- Connectors
- 0–1 crossings in main paths; arrowheads are consistent.
- Text
- No label overflow; casing and tense are consistent; key terms are legible at 100%.
- Style
- Palette ≤ 5 colors; line weights and fonts are consistent; contrast is sufficient.
- Scope and direction
- Clear Start/End; single reading direction; complex branches offloaded to sub-diagrams.
- Verification
- Test export checked; peer skim passed.
Sources and Further Reading
- ProcessOn official tutorials and product pages underpin tool locations and operations, including alignment/distribution, connector styling, and export. For a compact overview, see ProcessOn — How to make a flow chart? (2025), the ProcessOn Flowcharts product page (2025), the connectors and routing examples in ProcessOn — Process flow diagram tutorial (updated 2025), and export guidance in ProcessOn — Software architecture diagrams guide (2025).
- For why these fixes improve comprehension, explore Interaction Design Foundation — Visual hierarchy (2025), whitespace tips from Venngage — Using white space in design (2025), and practical “what not to do” reminders in Miro — Avoid mistakes, make diagrams clearer (2024).